要点速览
- 在 GB300 NVL72 集群上对 Qwen3.8-2.4T(92 层混合 GDN/Full-Attn + MoE)做 PD serving,工作负载 ISL/OSL=8192/1024,并发 1–2560。
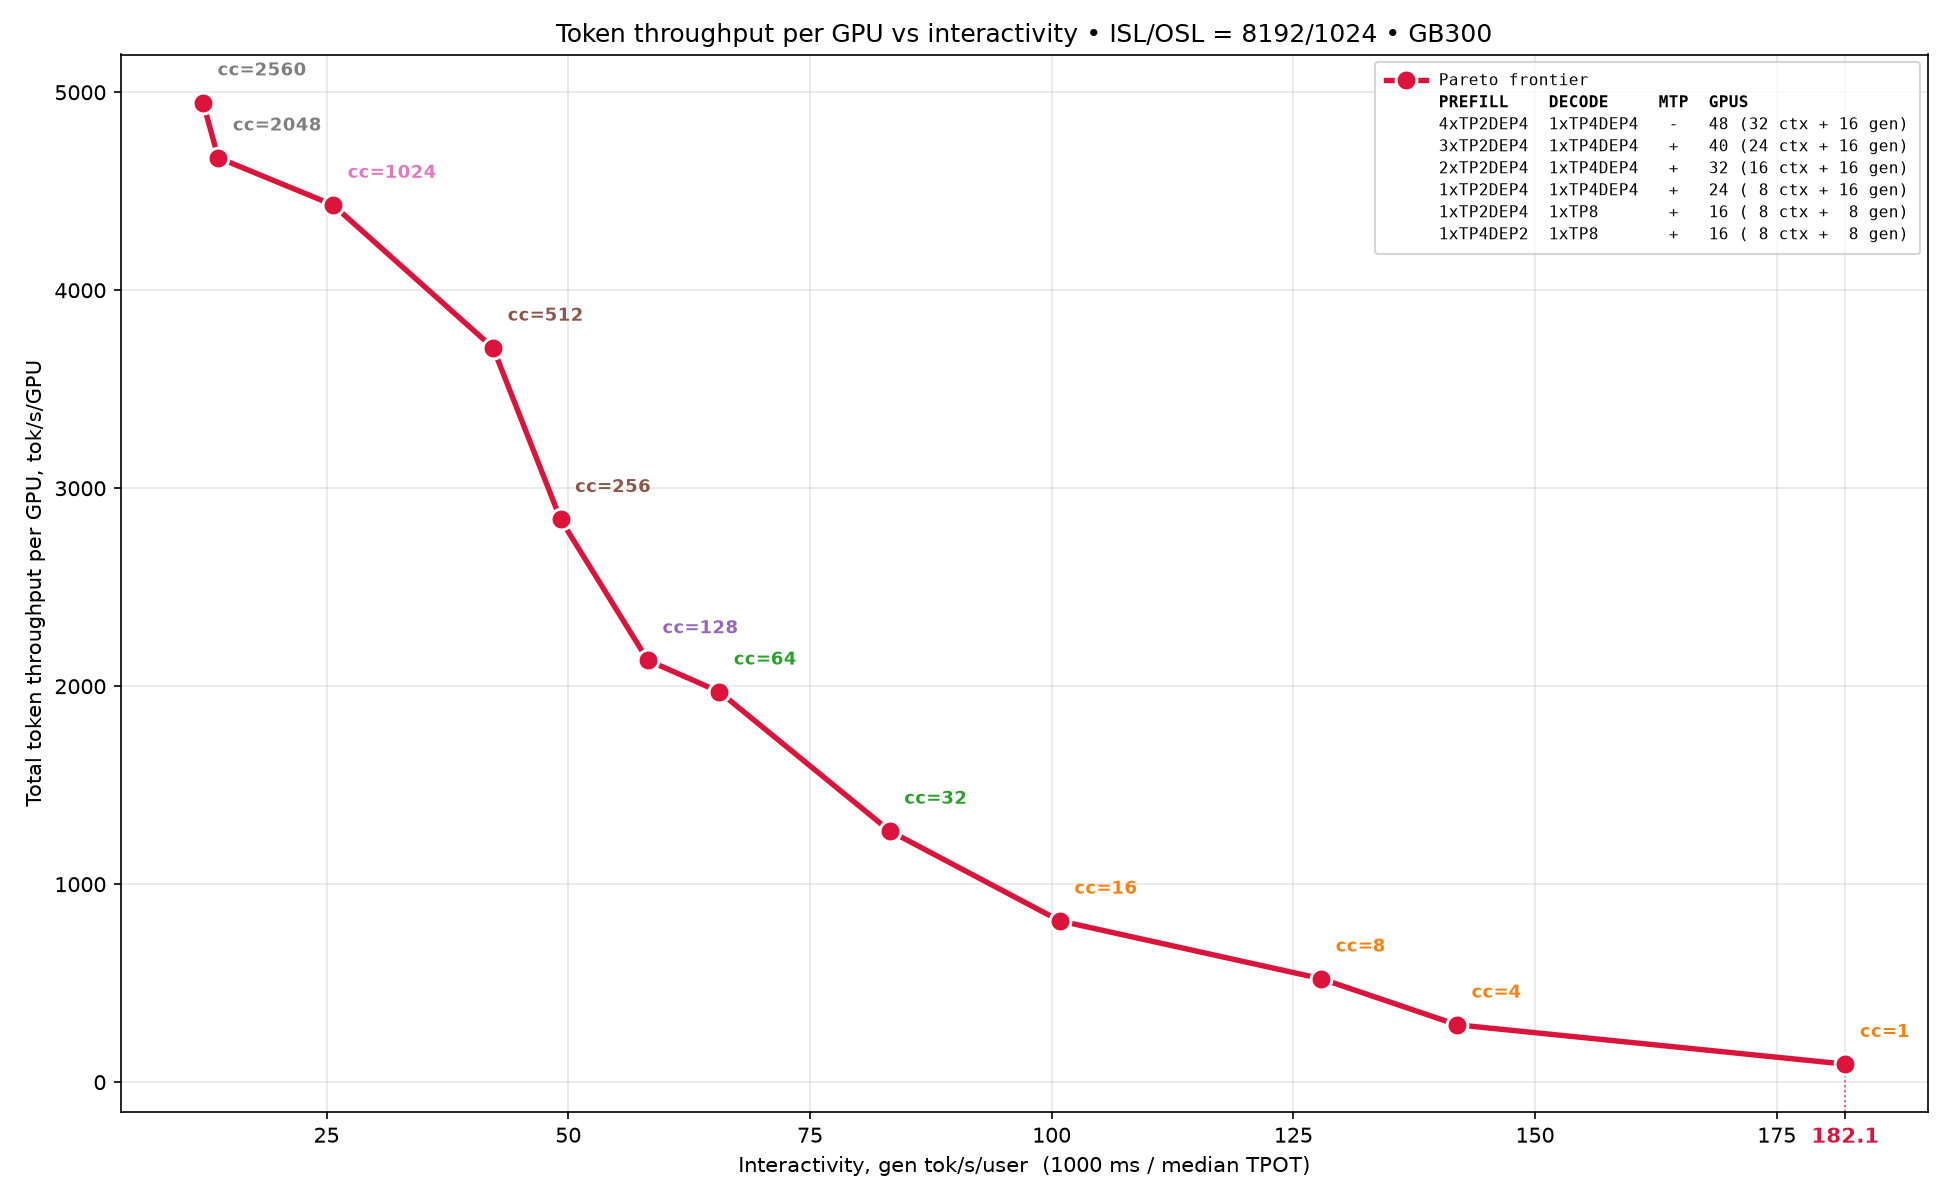
- 高吞吐场景达到每 GPU 5000 total token throughput,低延迟场景达到每用户 180 generated tokens/s,并给出覆盖两端的完整 Pareto 前沿。
- 方法论是分而治之:先精确估算单请求 KV cache(759 MiB)与每引擎 KV 容量,再分别测 prefill-only 与 decode-only 拓扑,最后组合成 PD 配置。
- Decode 最优拓扑随并发分段:≤256 并发 TEP8+MTP 最佳,512–1024 用 TEP8,≥2048 时因 KV cache 空间更大 TP4DP4+EP 胜出。
- 所有 PD 配置 GSM8K 精度均为 95%;全部配方以 srt-slurm recipes 形式开源,可一条命令复现。
解决什么问题
Qwen3.8-2.4T 是超万亿参数的混合架构前沿模型:92 层中有 69 层 GDN 和 23 层 Full-Attn,每层含 MoE 块(92×512 experts),MoE 权重即达 1242 GiB。在其上构建 PD 分离服务需要回答“哪种拓扑在什么并发下最优”这一组合爆炸式的问题。文章要解决的是如何系统地构建覆盖高吞吐(Total TPS/GPU)与低延迟(Gen TPS per user)两端的完整 Pareto 前沿,并把这套调优决策过程沉淀为任何模型都可复用的方法论与可复现配方。
核心思路
先把问题分解为可独立测量的小步:从 GB300 单卡的显存盘点出发,精确计算单请求 KV cache 占用——Full-Attn 状态按 token 计(每 token 每层 2 KiB)、GDN 状态按 request 计(conv 120 KiB + SSM 4 MiB),推出 block size 2112 token(4.125 MiB)与每请求 759 MiB,再除出每引擎最大并发。然后用 prefill-only(ISL/OSL=8192/2)与 decode-only(1/1000)负载分别扫描各拓扑的吞吐-并发曲线,选出两端最优拓扑。最后固定 decode 端点(1×TEP8 或 1×TP4DP4+EP)、变化 prefill 端点数量与形态(1–4 个),组合出完整 Pareto 前沿,并用 GSM8K 验证精度。全部配方通过 srt-slurm-recipes 开源,配合 AIPerf 一条命令复现。
关键要点
- 混合架构的 KV cache 精确估算 — Qwen3.8-2.4T 的 92 层中 GDN 与 Full-Attn 权重为 BF16、MoE 为 NVFP4:非 expert 权重 91 GiB(GDN 60 GiB + Full-Attn 19 GiB),expert 权重 1242 GiB。两类状态计量方式完全不同:Full-Attn 状态按 token 存储,每 token 每层 2 KiB(4 个 KV heads × head_dim 256 × 1 字节 float8_e4m3fn × 2 for K/V);GDN 状态按 request 存储,conv state 120 KiB + SSM state 4 MiB 共 4216 KiB。GDN 状态是 Full-Attn 的 2108 倍,因此 block size 由 GDN 决定并对齐到 16 字节:2112 token/块、4.125 MiB/块。P/D 两侧 block size 独立计算但 KV 传输要求一致,不一致时需手动设 --block-size 为能容纳 GDN state 的值,代价是浪费部分 KV cache 空间。
- 单请求占用与最大并发的推导 — 工作负载固定为 ISL=8192、OSL=1024(long-ISL、decode-bound 场景),加 chat template 余量后每请求约 10240 token。Full-Attn 需 ⌈10240/2112⌉×23 = 5×23 = 115 块,GDN 每 request 恰好 1 块 × 69 层 = 69 块,合计 184 块 × 4.125 MiB = 759 MiB(Full-Attn 474 MiB + GDN 285 MiB)。最大并发 = KV cache 容量 ÷ 759 MiB,这是纯除法且刻意忽略 MTP 预留的投机 token 槽位,因此 MTP 行应视作上限而非实际可达并发。
- GB300 显存盘点与拓扑对权重占用的影响 — GB300 起步 279 GB,driver 开销 2.28 GiB 后 vLLM 可用 276.62 GiB;CUDA context 约 3.13 GiB 无法控制;gpu_memory_utilization 默认再预留 8%(覆盖 activation 峰值等不可预测项);NCCL buffer 等非 PyTorch 开销约 2.90 GiB,加载权重前约剩 248 GiB。所有测量中“既非权重也非 KV cache”的开销稳定在约 20 GiB(约 7%)。权重占用随拓扑变化剧烈:TP8 每引擎 169.28 GiB,而 TP4DP4 仅 107.51–108.71 GiB,因此 TP4DP4 的 KV cache 更大(约 133 GiB vs 约 73–83 GiB)、并发更高(约 180 vs 约 98–112 reqs/engine)——追求最大并发时 TP4DP4 是 decode 首选拓扑。
- CUDA Graph 内存估算机制及其偏差 — CUDA graph 内存必须静态预分配:vLLM 枚举所有可用 graph 尺寸,按 M_largest + (n−1)×Δ 估算(假设每个后续 graph 都增加同样的增量 Δ)并在启动时一次性预留全部。实测 8 组配置中,eager 峰值 activation 为 0.56–2.24 GiB,而 graph 预留 0.91–8.95 GiB,偏差从浪费 56% 到低估 24% 不等;低估时正是 gpu_memory_utilization 的 8% 预留避免了 OOM。关键在于留给 KV cache 的空间由 graph 估算值而非实际用量决定,因此估算质量直接影响并发上限——对 Qwen3.8、Kimi-K3、DSV4 这类超万亿参数模型,这一机制值得进一步研究与改进。
- prefill-only 与 decode-only 分离测量 — 分别用 prefill-only(ISL/OSL=8192/2)与 decode-only(1/1000)的聚合 serving 负载扫描拓扑,显著减少 PD 全组合的测量工作量。prefill 侧测了 9 种拓扑:低并发(≤16)TP4DP2+EP 最佳,更大并发 TP2DP4+EP 占优。decode 侧测 4 种拓扑并尝试开 MTP(3 个 speculative tokens):MTP 在 KV cache 空间充足时大幅提升性能;≤256 并发 TEP8+MTP 最佳,512–1024 并发 TEP8 占优,≥2048 并发时 TP4DP4+EP 因 KV cache 空间比 TEP8 大而胜出。
- PD 组合与完整 Pareto 前沿 — 正式测量固定 decode 侧为单端点 8 或 16 GPU(1×TEP8 或 1×TP4DP4+EP),prefill 侧评估 1–4 个端点、8 到 32 GPU(1×TEP8、1×TP4DP2+EP、{1,2,3,4}×TP2DP4+EP)。每条 Pareto 曲线都是单一部署扫并发得到,曲线上的点只能由该配置达到;合并所有配置得到最终 Pareto 前沿——左端(高吞吐)5000 total TPS/GPU,右端(低延迟)180 gen tok/s/user。这与前作 Qwen3.5 研究只聚焦曲线左半形成互补。
- 精度验证与可复现性 — 所有选定 PD 配置先跑 GSM8K 精度验证,结果均为 95%,性能测量因此有效。复现需要:Qwen3.8-2.4T-A95B-NVFP4 权重(Inferact)、vllm/vllm-openai:nightly-a9a17 镜像(vLLM revision v0.26.1rc1.dev1177+ga9a17e709)、Dynamo 1.2.0.dev20260526、srt-slurm v1.0.98 与 AIPerf v0.12.0;全部配方(含 accuracy recipes)在 srt-slurm-recipes 仓库的 multi-node/Qwen3.8/GB300/8k1k/vllm/disagg 路径下。
关键数据
| 指标 | 数值 | 条件 |
|---|---|---|
| 高吞吐场景每 GPU 总吞吐 | 5000 tokens/s per GPU | Qwen3.8-2.4T NVFP4 / GB300 NVL72 / ISL/OSL=8192/1024 |
| 低延迟场景每用户生成速度 | 180 gen tok/s/user | 同上环境,Pareto 前沿右端低延迟配置 |
| 单请求 KV cache 占用 | 759 MiB | ISL 8192 + OSL 1024 + chat template ≈ 10240 token / 184 blocks / 4.125 MiB per block |
| GDN 每请求状态大小 | 4 MiB + 120 KiB = 4216 KiB | Qwen3.8-2.4T 单请求 GDN conv state + SSM state(按 request 而非按 token 存储) |
| KV block 大小 | 2112 tokens / 4.125 MiB per block | 由 GDN state(2108 token 等效)决定并对齐到 16 字节 |
| Full-Attn 每 token 状态 | 2 KiB / token / layer | 4 个 KV heads × head_dim 256 × 1 字节 float8_e4m3fn × 2(K 和 V) |
| expert 权重总量 | 1242 GiB(非 expert 权重另 91 GiB) | Qwen3.8-2.4T NVFP4 MoE 权重(GDN 与 Full-Attn 权重为 BF16) |
| GB300 单卡可用显存 | 279 GB 起步;driver 开销后 276.62 GiB | 单卡内存盘点;CUDA context 另占约 3.13 GiB,权重加载前约剩 248 GiB |
| 非权重非 KV cache 显存开销 | 约 20 GiB(约 7%) | GB300 上全部测量拓扑的稳定开销(CUDA context、NCCL、activation、graph 估算余量等) |
| CUDA graph 预留与实际使用偏差(示例) | 预留 7.93 GiB / 实际 6.04 GiB / 浪费 31% | TP8 + MTP / 85 个 graph 的 decode 引擎,FULL 模式测量 |
| 每引擎最大并发 | TP8 约 98–112 reqs/engine;TP4DP4 约 179–181 reqs/engine | KV cache 容量 ÷ 759 MiB/请求;TP4DP4 权重占用低故 KV cache 约 133 GiB |
| Decode 最优拓扑的并发分界 | ≤256: TEP8+MTP;512–1024: TEP8;≥2048: TP4DP4+EP | decode-only 负载 ISL/OSL=1/1000 / GB300 / 4 种拓扑对比 |
| GSM8K 精度 | 95% | 全部选定 PD serving 配置,与性能测量分开验证 |
“In high throughput scenario vLLM achieved **5000** total token throughput per GPU, and **180** generated tokens per user in the low latency scenario — both presented on [pareto frontier](#performance-results) below.”
“Finally we reached **5K** total token throughput per GPU and interactivity at **180** gen tok/s/user.”
“we divide KV cache size by the 759 MiB a single request needs, as computed in [KV cache estimation for single request](#kv-cache-estimation-for-single-request) above:”
前置知识
P/D disaggregation 基本架构与 prefill-only / decode-only 分离测量的思路 · MoE 模型并行策略:TP/DP/EP 及 TP4DP4、TEP8 等组合拓扑的含义 · 混合架构模型(GDN/Mamba 类 SSM 层 + Full-Attention 层)的状态管理差异 · KV cache 分块(block size)机制与 P/D 两侧 block size 一致性要求 · GPU 显存构成:weights、activations、CUDA graphs、CUDA context、NCCL buffers · MTP speculative decoding、Pareto 前沿概念与 srt-slurm/Dynamo 推理工具链
术语表
GDN: Gated Delta Network,线性注意力/SSM 类层,状态按 request 而非按 token 存储,含 conv state 与 SSM state 两部分。Full-Attn: 全注意力层,KV cache 随 token 数线性增长,与 GDN 层的计量方式完全不同。Pareto frontier: 吞吐与每用户延迟权衡下所有有效配置构成的集合,其中任何一端的改进必然以另一端为代价。NVFP4: NVIDIA 4-bit 浮点量化格式,本文用于 MoE expert 权重以大幅压缩权重占用。GB300 NVL72: NVIDIA GB300 Grace Blackwell 超节点,72 张 GPU 经 NVLink 互联,单卡显存约 279 GB。TEP: Tensor Parallel + Expert Parallel 组合拓扑,低并发时每用户性能较好。TP4DP4: 4 卡张量并行 × 4 份数据并行的组合,每引擎权重占用低、KV cache 空间大,适合高并发 decode。MTP: Multi-Token Prediction 投机解码,一次验证多个 draft token 以提升 decode 吞吐。ISL/OSL: Input/Output Sequence Length,输入/输出序列长度,本文工作负载为 8192/1024。srt-slurm: NVIDIA 的推理部署编排工具,配方可经 srtctl run 一条命令启动并复现。AIPerf: 用于压测与性能测量的工具,配合 srt-slurm recipes 完成 Pareto 扫描。CUDA graph: 预录制的 kernel 执行图,replay 时无 CPU 启动开销,但内存需按估算静态预分配。Concurrency: 同时被服务的请求数,直接受 KV cache 容量约束,是吞吐的上游变量。
PD Serving of Qwen3.8-2.4T
TL;DR
In this blog post we present our latest performance results on PD serving of the Qwen3.8-2.4T model using vLLM on a GB300 NVL72 cluster on 8K/1K workload. In high throughput scenario vLLM achieved 5000 total token throughput per GPU, and 180 generated tokens per user in the low latency scenario — both presented on pareto frontier below. In this blog post we explain in detail how we achieved these results, and give precise srt-slurm recipes to allow anyone to verify and reproduce them using local serving. But what is more important — we describe our decision making process we used to create these recipes. This is even more important than the actual performance results, since it allows you to squeeze performance out of PD serving on vLLM for any model you desire.
Introduction
Recently, we presented our Qwen3.5 PD serving results and showed that vLLM could reach 25K Total TPS/GPU. Straight after that, a new frontier Qwen-family model was released: Qwen3.8-2.4T. In this post, we turn to PD serving for Qwen3.8-2.4T and present the full pareto frontier.
In our previous Qwen3.5 study, we focused primarily on left part of pareto curve, where the goal was to maximize Total TPS/GPU. This time, we go further and build the complete pareto frontier, covering both its left (high throughput) and right (low latency) parts. In other words, besides throughput-oriented configurations, we also identify optimal PD recipes for maximizing interactivity, i.e. Gen TPS per user.
Just as importantly, this blog post is not only about the final numbers. We also break down the tuning process step by step: how we chose what to measure, how we identified bottlenecks, and how we iterated toward better PD configurations. Our aim is to make this workflow understandable and reusable for anyone trying to tune serving performance for any another model.
Maximizing Throughput
The first metric we aim to maximize is total token throughput per GPU. This metric depends on concurrency: more requests a decode engine serves at once, higher throughput we get. What caps concurrency is KV cache capacity, since every active request holds a slice of it. KV cache size is thus the first question to answer for any topology, and it splits in two: how much cache a single request consumes, and how much is left on the GPU once model weight are loaded and vLLM server accocated space for its own work. The rest of this chapter works through both halves and arrives at the maximum concurrency theoretically reachable for Qwen3.8-2.4T on a single GB300.
KV cache estimation for single request
Qwen3.8-2.4T has 92 layers: 69 GDN layers and 23 Full-Attn layers, with an MoE block in every layer (92 × 512 experts). GDN and Full-Attn are BF16, MoE is NVFP4. Weights are classified as follows:
- 91 GiB — non-expert weights of the model (60 GiB for GDN weights and 19 GiB for Full-Attn weights)
- 1242 GiB — expert weights of the model
Since Qwen3.8-2.4T is a hybrid model, its state comes in two parts that are accounted for very differently: Full-Attn state grows with every token, while GDN state is stored per-request.
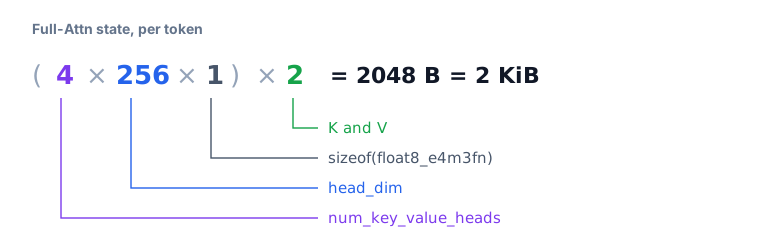
Full-Attn state is stored per token. One token needs 2 KiB per layer:
GDN state is stored per request not per token, this is important. It consists of two parts.
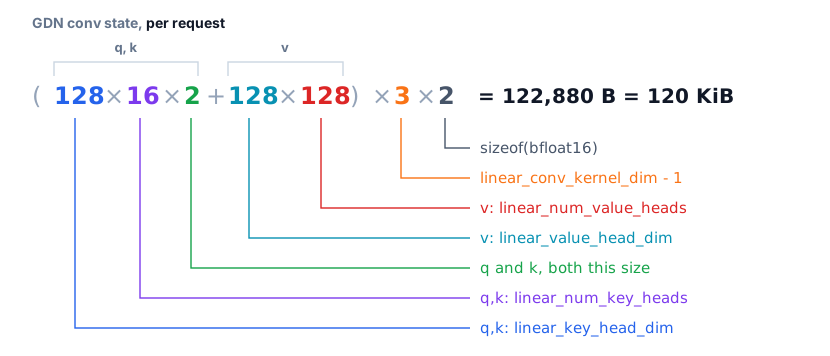
- Conv state — the last kernel-1 inputs of the causal conv, one filter per channel, where the channels are q, k and v concatenated:
- SSM state — recurrent matrix that holds whole context:
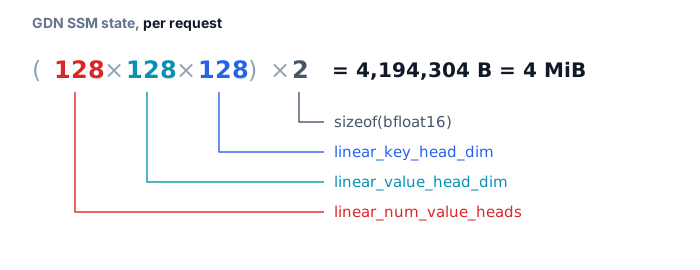
Summing it up, GDN state needs 4 MiB + 120 KiB = 4216 KiB.
vLLM allocates KV cache in blocks, and block has to be large enough to be able to hold either a single GDN state or some number of Full-Attn states. For Qwen3.8-2.4T GDN state dominates Full-Attn state by 4216 KiB / 2 KiB = 2108 times. Block size is then determined by GDN state and aligned to 16 bytes, so align(2108, 16) = 132 * 16 = 2112 tokens fit into one block, making the block 2112 × 2 KiB = 4.125 MiB.
One thing to keep in mind for disaggregated serving: prefill and decode compute their block sizes independently, but KV cache transfer requires both to match. If they do not, set --block-size manually to a value large enough to hold GDN state on both sides, at the cost of some wasted KV cache space.
Now that we calculated size of a single block, we can find out how much KV cache one full request occupies, and from that estimate maximum concurrency we can expect in our measurements. This calculation needs a workload estimation. We fixed ISL=8192 and OSL=1024 — the so-called long-ISL, decode-bound testing scenario.
One request spans ISL, OSL, and a small reserve for chat template used by OpenAI API requests. With 2112 tokens per block, 23 Full-Attn layers and 69 GDN layers, per-request overhead can be calculated this way:
$$ \begin{aligned} N_{\text{tok}} &= \text{ISL} + \text{OSL} + \text{chat template} = 8192 + 1024 + \ldots \;\approx\; 10240 \;\text{tokens} \[4pt] B_{\text{Full-Attn}} &= \left\lceil \frac{N_{\text{tok}}}{2112} \right\rceil \times 23 = 5 \times 23 = 115 \;\text{blocks} \[4pt] B_{\text{GDN}} &= 1 \times 69 = 69 \;\text{blocks} \[4pt] B_{\text{total}} &= B_{\text{Full-Attn}} + B_{\text{GDN}} = 115 + 69 = 184 \;\text{blocks} \[4pt] M_{\text{req}} &= 184 \times 4.125\;\text{MiB} = \mathbf{759}\;\textbf{MiB} \end{aligned} $$
Full-Attn state grows with tokens number, so it needs one block per 2112 tokens in each of the 23 layers. GDN state is fixed per request, so it needs exactly one block in each of the 69 layers. Splitting the total between the two:
$$ M_{\text{Full-Attn}} = 115 \times 4.125\;\text{MiB} = 474\;\text{MiB}, \qquad M_{\text{GDN}} = 69 \times 4.125\;\text{MiB} = 285\;\text{MiB} $$
KV cache uses GPU memory left over after model loading and all other reservations, so the first step is to determine every memory consumer that allocates memory.
KV cache capacity
GB300 gives us 279 GB to start with. Initially driver overhead takes 2.28 GiB. So, vLLM on start has 276.62 GiB in total. Before the vLLM server starts about 3.13 GiB is already taken by the CUDA context. This is memory we have no control over whatsoever and no way to adjust.
On top of that, by default vLLM reserves 8% of the 276.62 GiB baseline for whatever cannot be predicted in advance — activation memory peak and similar effects. This is what the gpu_memory_utilization setting controls. That already leaves us with ~254 GiB.
Another 2.90 GiB goes into NCCL buffers, allocator and other non-PyTorch related things. So, before weights loading we have 276.62 × 0.92 − 3.13 − 2.90 = 248 GiB.
Peak activations
After weights loading vLLM measures how much memory a model step consumes in eager mode, that is, without CUDA graphs. This is necessary because CUDA graphs themselves are capped at some maximum size, and during inference batch size can exceed that cap — we still have to run the pass somehow, and that is when we need to use eager mode. Such cases are of course worth avoiding as much as possible because of performance degradation, but in practice there is no way to guarantee they never happen in runtime. Eager mode pass is run with max_num_batched_tokens tokens, so that the activation peak is measured in the worst case scenario.
The easiest way for you to estimate memory consumption is to do a few test runs of decode topologies you interested in using aggregated mode. For the topologies covered in this blog post, we got the following peak activations per engine:
| Run | Topology | MTP | max-num-seqs | max-num-batched-tokens | peak activations (GiB) |
|---|---|---|---|---|---|
| 1 | TP8 | + | 20 | 96 | 0.57 |
| 2 | TP8 | + | 32 | 144 | 0.58 |
| 3 | TP8 | + | 80 | 336 | 0.56 |
| 4 | TP8 | + | 272 | 1104 | 1.91 |
| 5 | TP4DP4 | + | 80 | 336 | 1.72 |
| 6 | TP4DP4 | + | 272 | 1104 | 2.24 |
| 7 | TP4DP4 | − | 528 | 544 | 1.83 |
| 8 | TP4DP4 | − | 656 | 672 | 2.15 |
CUDA graphs
After that, vLLM captures CUDA graphs. Memory for graphs must be pre-allocated at static addresses, which means memory that graph needs has to be estimated before the graph will be captured.
By this day vLLM implements this the following way. First we enumerate every graph size available for the server configuration. Only one graph can be replayed at a time, and the larger the graph, the more memory it consumes at peak — so at the very least we must have room for the largest one. The next question is how much extra memory the rest of them need, and here the picture differs from the eager run: once a graph has been captured, replaying it reuses the exact same addresses. Capture the second-largest graph as well and you find that it costs some extra memory $\Delta$ on top of the memory the first graph has already used.
To save warmup time, vLLM then makes the following assumption: that this same $\Delta$ is added by every subsequent graph. Memory needed for CUDA graphs is computed as $M_{\text{largest}} + (n - 1)\,\Delta$, where $M_{\text{largest}}$ is the memory of the largest graph and $n$ is the total number of graphs. And because graphs use static addresses, and because we cannot capture all of them at startup, we are forced to use that estimate to claim the whole amount beforehand.
In practice estimate often exceeds the memory graphs actually need by a wide margin. To measure it for yourself, do test runs for decode topologies in aggregated mode with compilation-config: '{"cudagraph_mode": "FULL_DECODE_ONLY"}' with max-cudagraph-capture-size.
For the topologies covered in this blog post, we got the following memory consumption in FULL mode per engine:
| Run | Topology | MTP | # Graphs | Reserved (GiB) | Actually Used (GiB) | Never Used (GiB) | % |
|---|---|---|---|---|---|---|---|
| 1 | TP8 | + | 11 | 0.91 | 0.59 | 0.32 | 54% |
| 2 | TP8 | + | 17 | 1.28 | 0.82 | 0.46 | 56% |
| 3 | TP8 | + | 37 | 1.87 | 1.88 | −0.01 | −1% |
| 4 | TP8 | + | 85 | 7.93 | 6.04 | 1.89 | 31% |
| 5 | TP4DP4 | + | 37 | 8.35 | 6.52 | 1.83 | 28% |
| 6 | TP4DP4 | + | 85 | 7.56 | 9.90 | −2.34 | −24% |
| 7 | TP4DP4 | − | 52 | 8.29 | 7.51 | 0.78 | 10% |
| 8 | TP4DP4 | − | 60 | 8.95 | 8.07 | 0.88 | 11% |
The table also makes it obvious why the gpu_memory_utilization reservation exists in the first place. In some of these runs the memory graphs use more memory that initial estimation, and that extra reservation is exactly what keeps such a case from turning into OOM.
It is important to note that memory space left for KV cache is driven by CUDA graph estimate, not by what graphs actually use in runtime, so KV cache size depends directly on how good that estimate is. In our case it is a good estimate, but if you want to optimize the final percentages, you should probably estimate graphs size manually. Graphs estimation mechanism in vLLM definitely deserves further study and improvement, because with the arrival of over-trillion-parameter frontier models such as Qwen3.8, Kimi-K3 and DSV4 the question becomes pressing.
Maximum concurrency per engine
Now it is time to take all the previous results together and calculate how many requests per engine vLLM can handle for our model. As was said before, GB300 gives us 276.62 GiB. Some of its memory is reserved by gpu_memory_utilization. In our case we used the default value gpu_memory_utilization=0.92. So, initially available memory per engine is 276.62 GiB × 0.92 = 254.5 GiB.
Every column in the table below except the last one is measured: these are the numbers the vLLM server reports at startup. The last column is derived from them — we divide KV cache size by the 759 MiB a single request needs, as computed in KV cache estimation for single request above:
$$ \text{reqs/engine} = \frac{M_{\text{KV cache}}}{M_{\text{req}}} = \frac{M_{\text{KV cache}}}{759\;\text{MiB}} $$
This is a plain division and it deliberately ignores the extra KV slots MTP reserves for speculative tokens, so for MTP rows treat it as an upper bound rather than the concurrency actually reachable.
| Run | Topology | MTP | CUDA ctx (GiB) | non-torch (GiB) | weights (GiB) | peak act (GiB) | graph est (GiB) | KV cache (GiB) | reqs/engine |
|---|---|---|---|---|---|---|---|---|---|
| 1 | TP8 | + | 2.54 | 0.72 | 169.28 | 0.57 | 0.91 | 83.00 | 112.0 |
| 2 | TP8 | + | 2.54 | 0.72 | 169.28 | 0.58 | 1.28 | 82.63 | 111.5 |
| 3 | TP8 | + | 2.54 | 1.19 | 169.28 | 0.56 | 1.87 | 81.60 | 110.1 |
| 4 | TP8 | + | 2.54 | 2.40 | 169.28 | 1.91 | 7.93 | 72.97 | 98.4 |
| 5 | TP4DP4 | + | 3.13 | 1.98 | 108.71 | 1.72 | 8.35 | 133.74 | 180.4 |
| 6 | TP4DP4 | + | 3.13 | 2.22 | 108.71 | 2.24 | 7.56 | 133.77 | 180.5 |
| 7 | TP4DP4 | − | 3.13 | 2.90 | 107.51 | 1.83 | 8.29 | 133.96 | 180.7 |
| 8 | TP4DP4 | − | 3.13 | 3.03 | 107.51 | 2.15 | 8.95 | 132.85 | 179.2 |
From this table we can make several observations. First, in every case we measured, the memory spent on everything that is neither weights nor KV cache comes to ~20 GiB, about 7% of the total memory available. Second, the space given to the model weights varies quite a lot with the topology. Maximizing total token throughput per GPU calls for high concurrency, and concurrency is ultimately limited by the memory available for the KV cache. The only way to free up more of it is to shrink what the model itself requires — which is what makes TP4DP4 the topology to use on decode when chasing top concurrency.
Measure prefill performance
The next important step towards our goal is to measure prefill performance separated from decode. This means running aggregated serving on a prefill-only workload, ISL/OSL=8192/2. This will show us the best topology that we should select for prefill endpoints in disaggregated serving. Such an approach of measuring prefill-only and decode-only workloads separately allows us to select the best topologies and to significantly reduce the amount of work needed for measuring performance of PD serving. In our case we selected the following topologies for prefill:
- TP4DP2+EP
- TP2DP4+EP
- TP4DP4+EP
- TP2DP8+EP
- DP16+EP
- TP1PP6+EP
- TP1PP8+EP
- TP8+EP
- TP16+EP
Here are our measurement results:
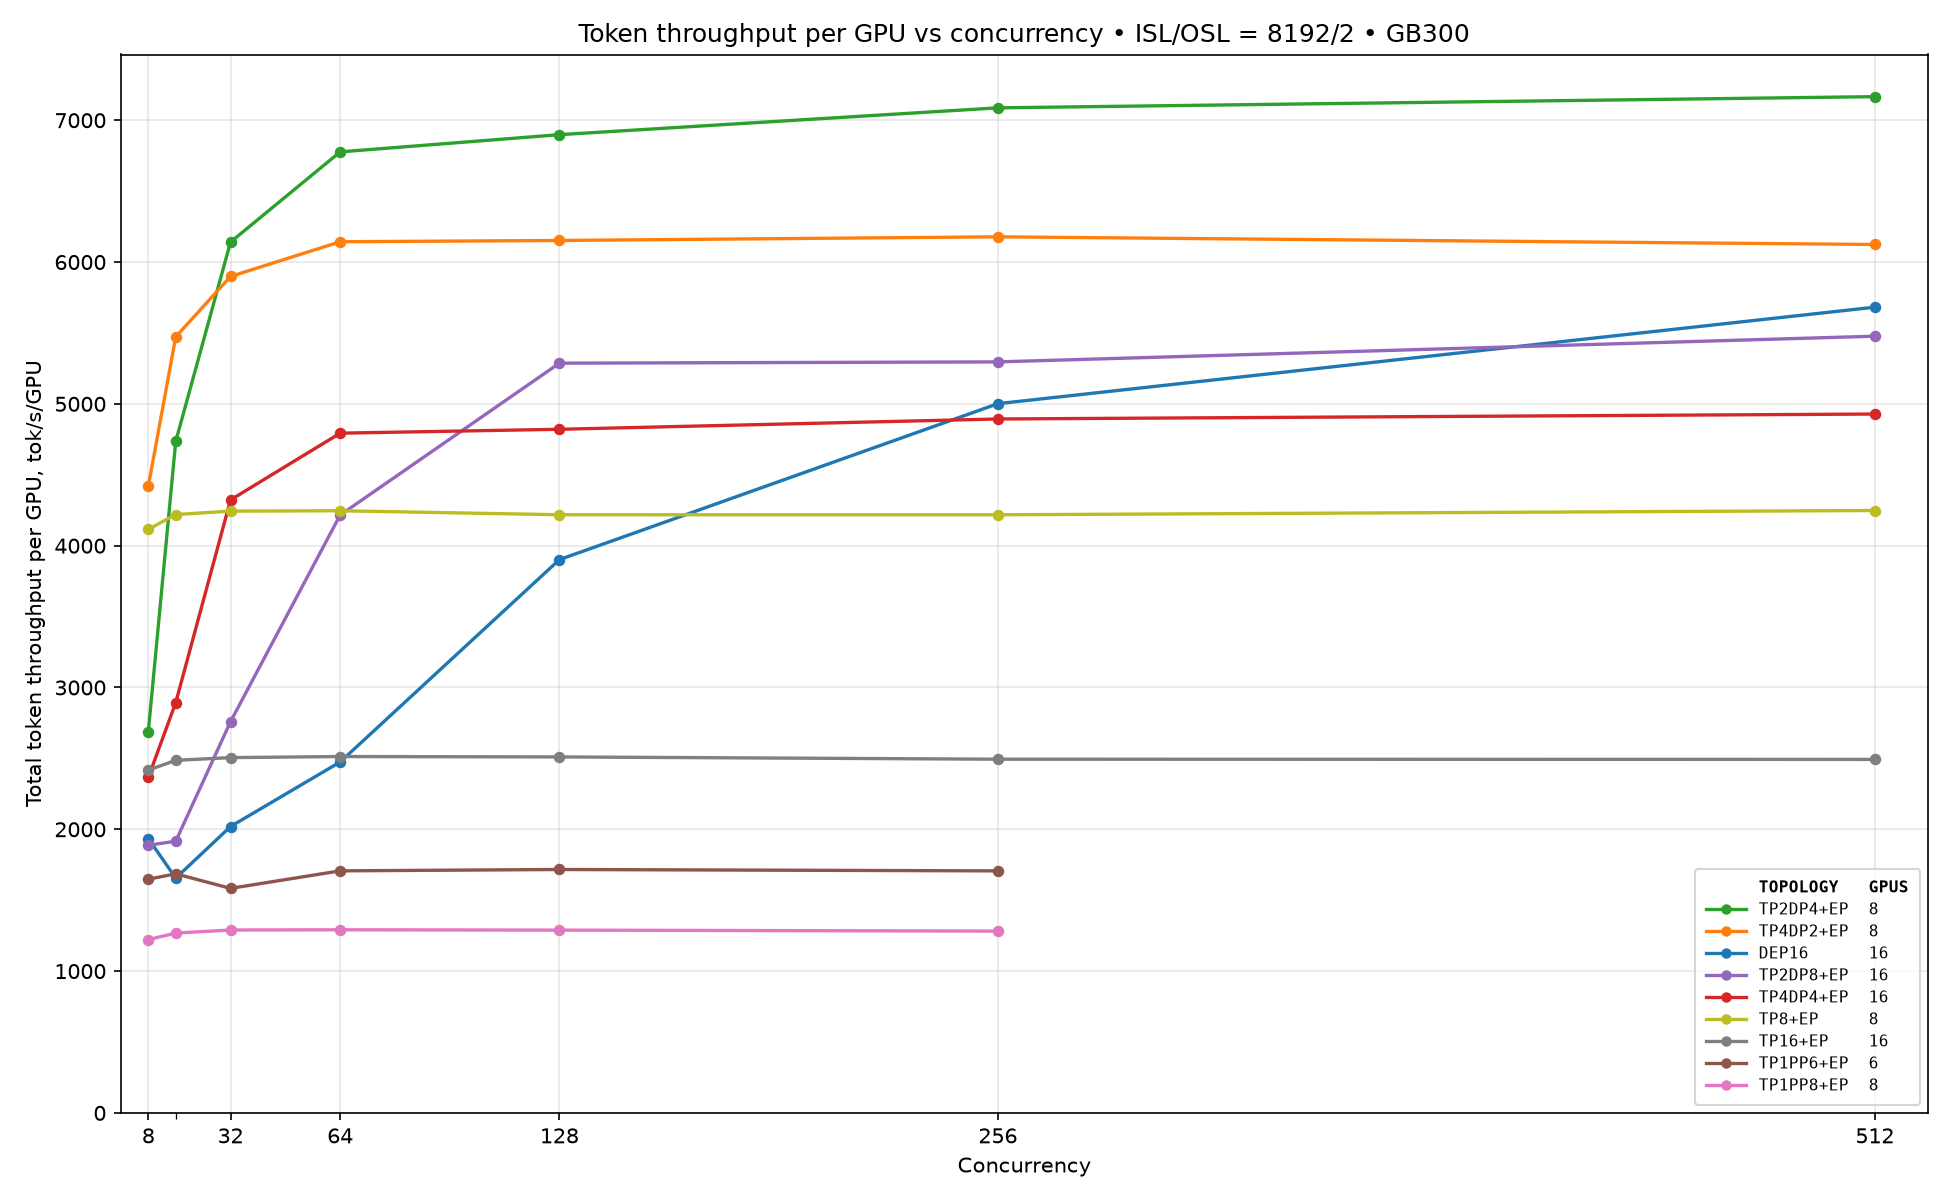
As we can see, for low concurrencies $\le 16$ the TP4DP2+EP topology shows the best performance. For larger concurrencies TP2DP4+EP starts to dominate.
Measure decode performance
The same thing we do for decode. We run aggregated serving with a decode-only workload, ISL/OSL=1/1000. We selected the following topologies:
- TP2DP4+EP
- TP4DP8+EP
- TEP8
- TEP16
Also, we tried to enable MTP with 3 speculative tokens, as it should help to get better performance results.
Here are our measurement results:
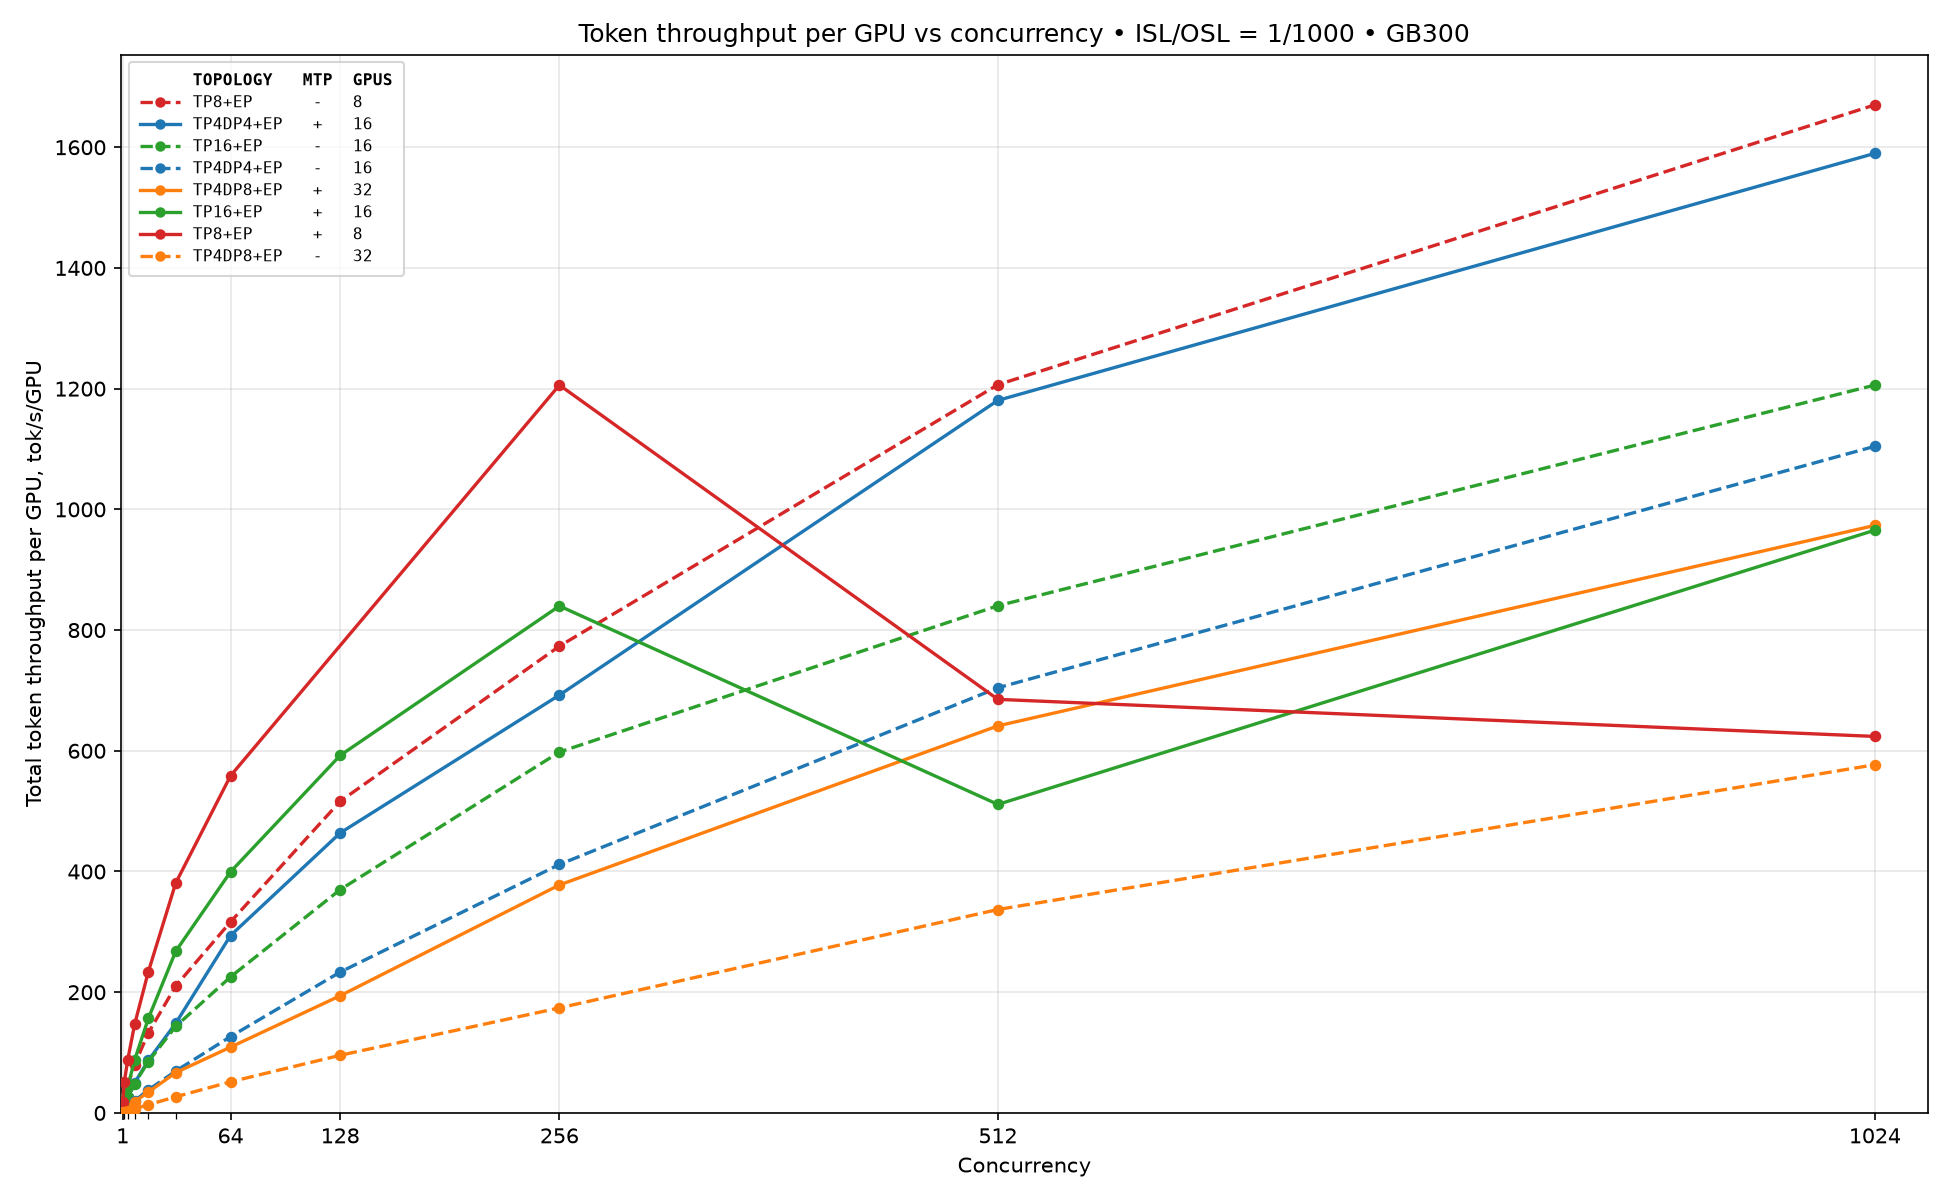
As we can see, firstly MTP drastically improves performance until there is enough available space for KV cache. As well, for concurrencies $\le 256$ the best topology is TEP8 with MTP, then for concurrencies 512 and 1024 the TEP8 topology dominates, and on high concurrencies $\ge 2048$ TP4DP4+EP outperforms every other because it has more space for KV cache compared to the TEP8 topology.
Now we have everything required for disaggregated pareto measurements.
Disaggregated Performance Results
Environment Setup
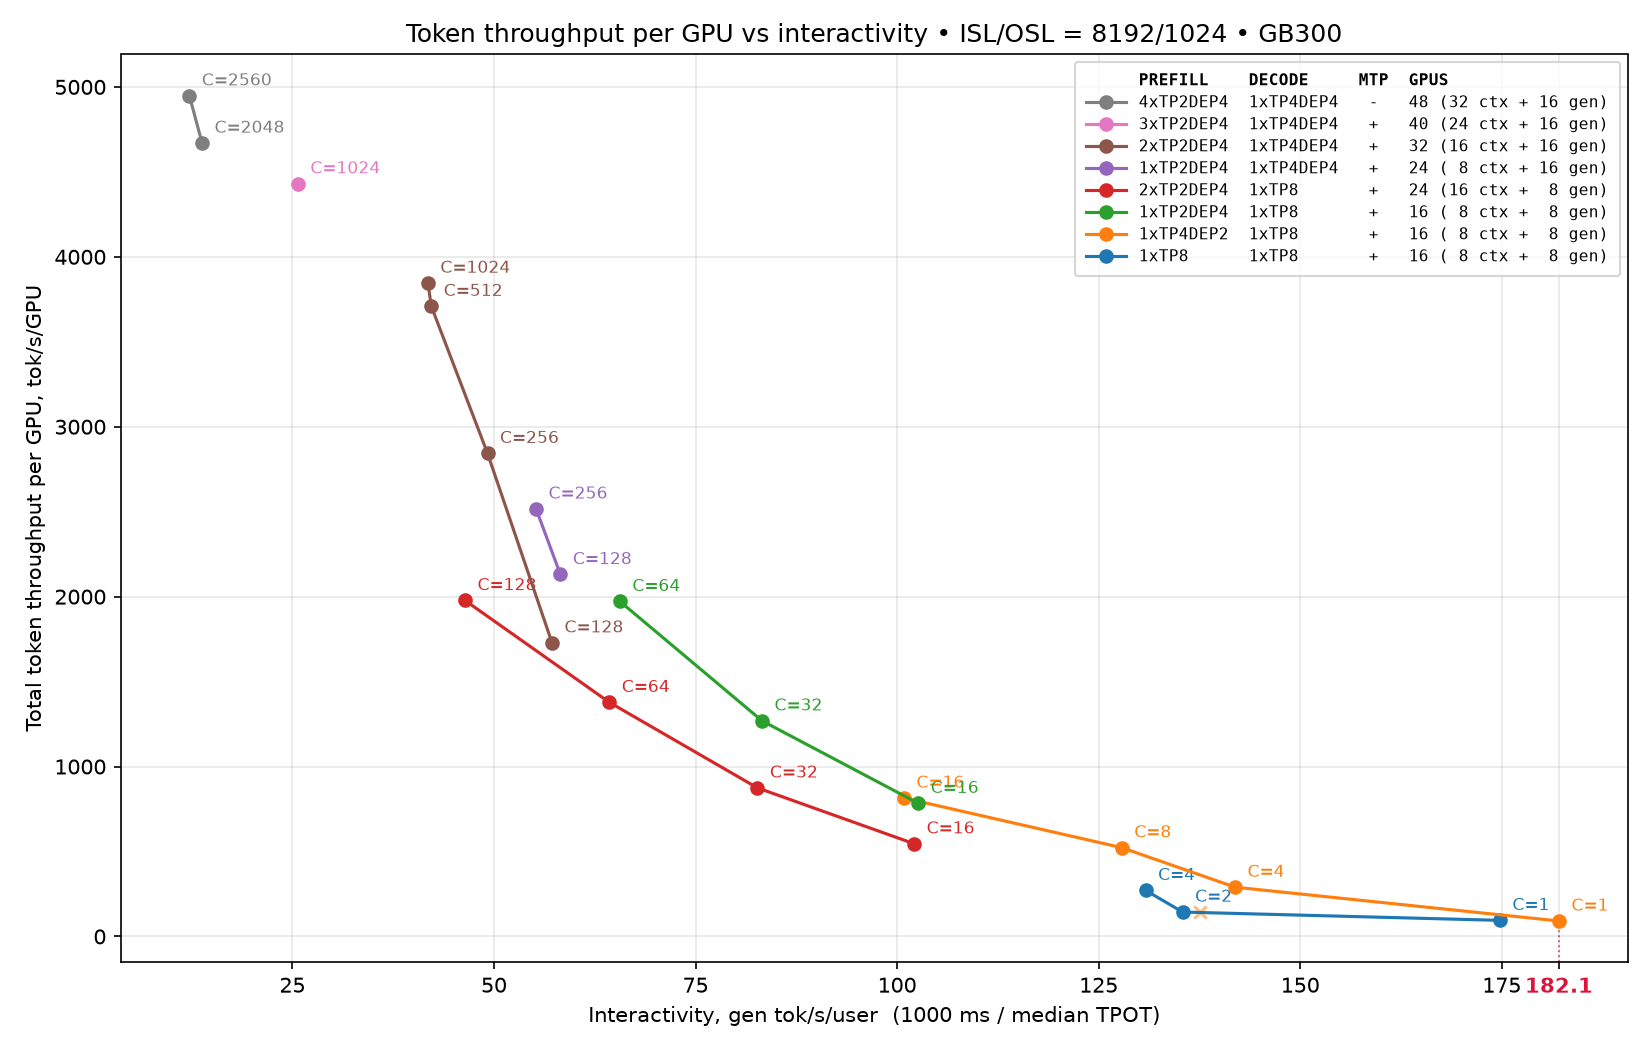
Measurements were conducted on a GB300 cluster connected via NVLink72. We used ISL/OSL = 8192/1024 with concurrency ranging from 1 to 2560. Performance was measured on a fixed decode topology and a constant number of decode endpoints. In this setup, the decode side used one endpoint with 8 or 16 GPUs:
- 1×TEP8
- 1×TP4DP4+EP
On the prefill side, we evaluated configurations ranging from 1 to 4 endpoints, each using from 8 up to 32 GPUs:
- 1×TEP8
- 1×TP4DP2+EP
- {1,2,3,4}×TP2DP4+EP
To reproduce the results, use the Qwen3.8-2.4T NVFP4 model, latest vLLM vllm/vllm-openai:nightly-a9a17 Docker image (vLLM revision v0.26.1rc1.dev1177+ga9a17e709), Dynamo 1.2.0.dev20260526, srt-slurm v1.0.98, and AIPerf utility. All recipes used in this blog post are available in the srt-slurm-recipes repository.
Accuracy Results
The first thing we did was accuracy verification for all the selected configurations of PD serving. Accuracy recipes that you can run yourself using srt-slurm are available in the same repository. We used the standard GSM8K (Grade School Math 8K) benchmark. The final accuracy result is 95% for each PD configuration. Now we can proceed to performance measurements.
Performance Results
Pareto curves for the individual configurations are shown below. Every curve is a single deployment swept over concurrencies, so each point is reachable only by the configuration whose curve it sits on.
Combining all of them gives the final pareto frontier:
Conclusion
In this blog post we showed how such a complex task as building a pareto curve for a frontier Qwen-family model could be decomposed into several smaller independent steps. Finally we reached 5K total token throughput per GPU and interactivity at 180 gen tok/s/user.
Acknowledgements
Artem Perevedentsev (NVIDIA), Vadim Gimpelson (NVIDIA), Xin Li (NVIDIA)
We would also like to thank vLLM community members for contributing and reviewing some optimization efforts mentioned in this blog post.